The Wide Range of World Maps
You might wonder, why are there so many different types of map projections? Well, in a similar analogy, there is more than one way to flatten an orange peel. Some projections focus on perserving the shape of the countries, where as others focus on the bending longitudinal lines near the poles. Different map projects are created to meet different needs, however, the common mistake is that there is one correct projection. Learn more about the different projections, and what each of their strengths are below!
There are three types of World Maps
- Cylindrical Map Projections
- Conic Map Projections
- Azimuthal Map Projections
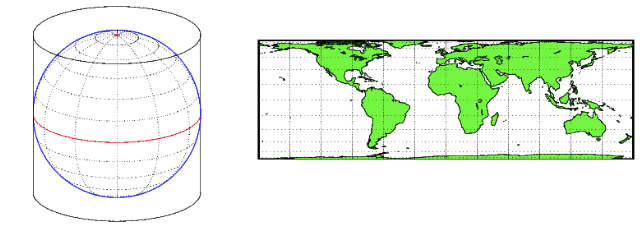
TYPE 1: Cylindrical Map Projections
These types of map projections include the very well-known Mercator, Cassini Gauss-Kruger, Miller, Behrman, Hobo-Dyer, and Gall-Peters. All of these maps have straight coordinate lines with horizontal parallels crossing meridians at right angles. Here, all meridians are equally spaced out and the space is constant along each parallel. Cylindrical maps are very useful for comparing latitudes however they are not great depictions of how the world really looks. Because of the equator being a horizontal line across earth, the area near the equator is most likely to be accurate compared to the area directly around it. The issue, however, lies when the parallels and meridians don’t allow for the curvature of the Earth, which is why there is such a controversy when it comes to the Mercator Projection as an accurate representation.
To learn more about the issues that lie with the use of the Mercator Projection, click on “Why Maps are Bias”.
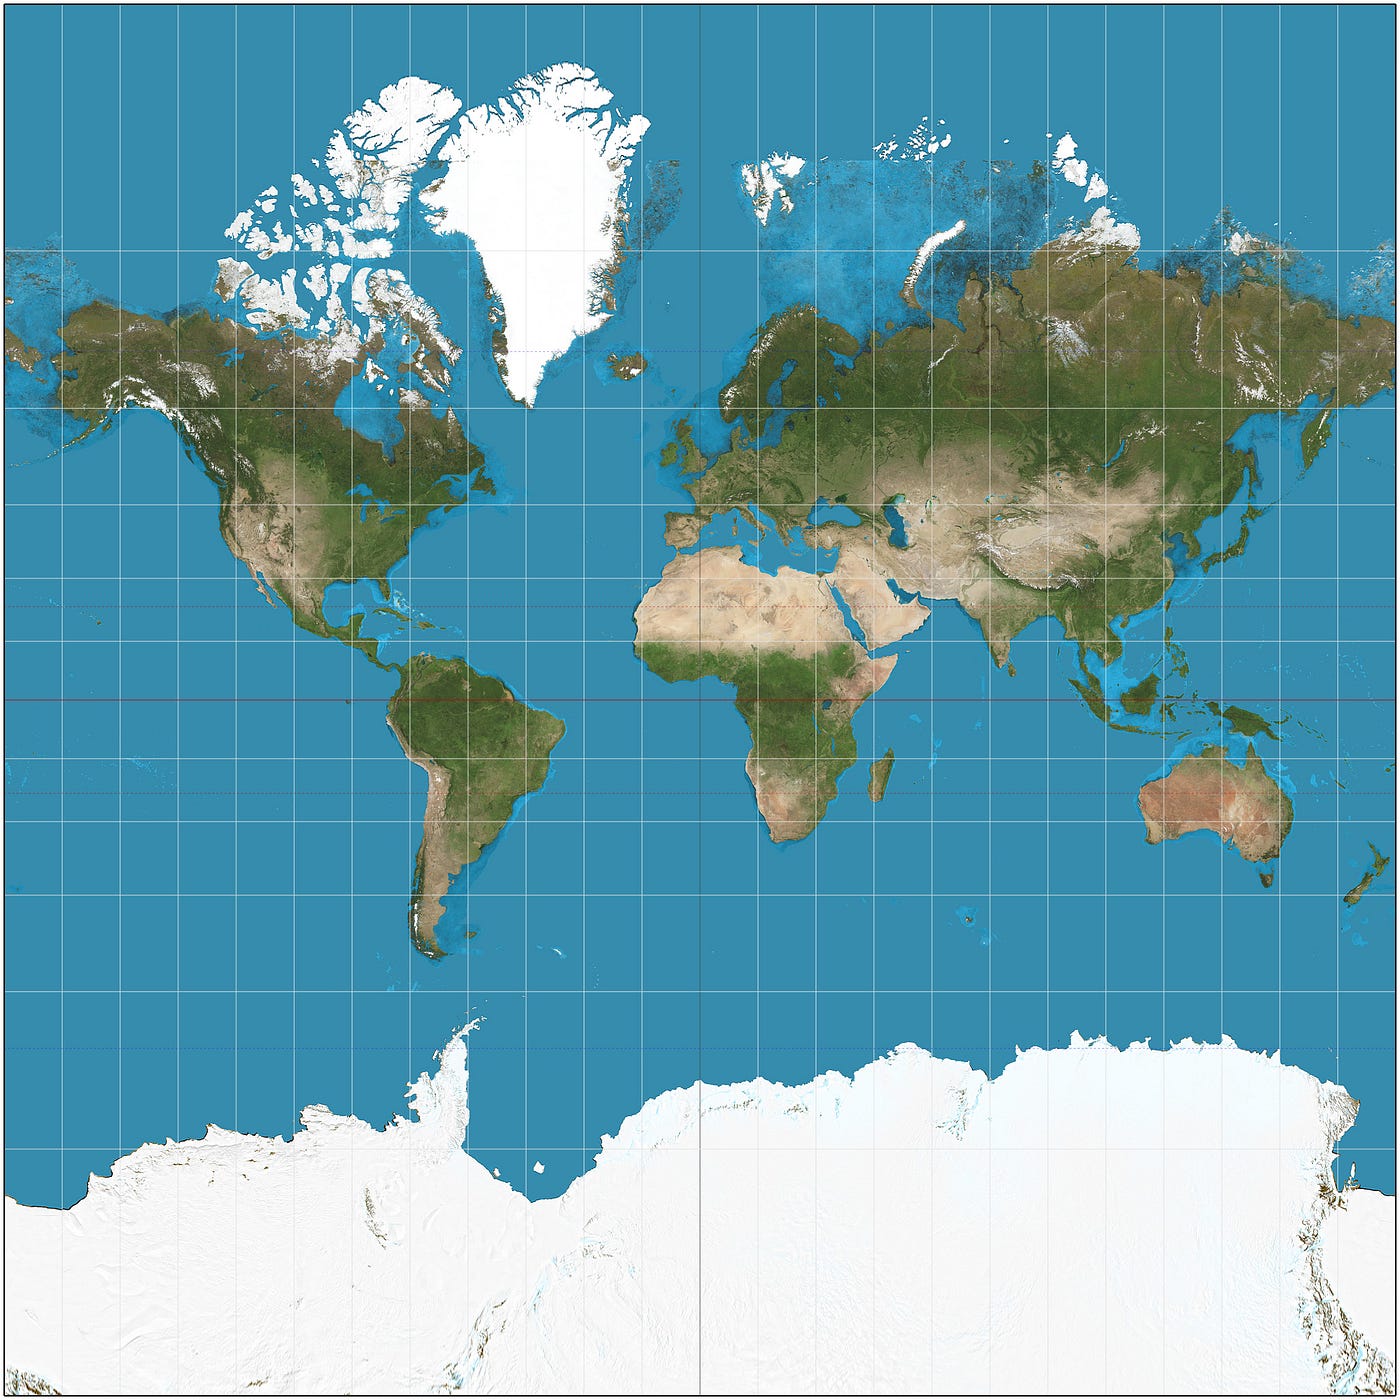
A. Mercator Projection:
Developed in the 16th century, this map is great for navigation because all the longitude and latitude lines are same. This map also shows the continent shape but are unrealistic in size, leading to a lot of map bias.
B. Gauss-Kruger Projection:
This map, also known as the ellipsoidal version of the transverse Mercator projection, is quite similar to the Mercator except for the fact that the cylinder touches the sphere along a meridian instead of along the equator. This placement of the central meridian on the center of the region helps minimize distortion for all properties.

C. Miller Projection:
Developed by Osborn M. Miller in 1942, this map is used for general world maps that do not require accurate areas and those who phenomena change with longitude. However, because of the distortion in polar regions, the use is not recommended.
link to the miller projection: https://desktop.arcgis.com/en/arcmap/latest/map/projections/miller-cylindrical.htm
D. Behrman Projection:
Introduced by Walter Behrman in 1910, this map is considered a cylindrical equal-area map projection with standard parallels set at 30 degrees north and south. Because of the equal-area property, it highly compresses the polar regions.

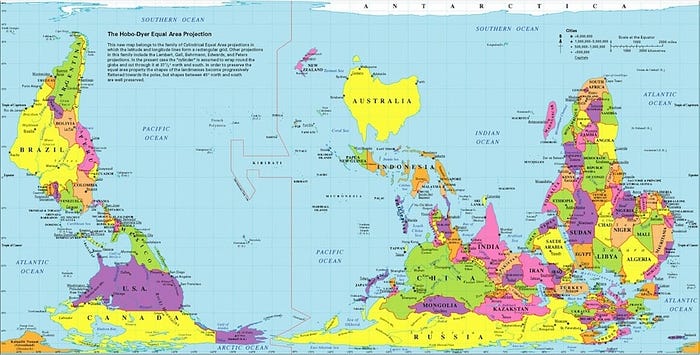
E. Hobo-Dyer Projection:
This map offers less of an elongation than the Peters map does, but there is more compression at the poles. Here, the south is up, the pacific is centered with equal areas on either side. The change in the location of the Global North shifts typical perspectives of most maps.
F. Gall Peters Projection:
This is an Equal Area projection with standard parallels at 45 degrees, however it results in distorting the shape that is stretched about the equator as well as results in compression at the poles. The advantage of this map is that all the countries are in correct size relation to each other, leaving it as the icon of world equality.
link to the Gall Peters Projection: https://www.maptorian.com/peters-projection-vector-world-map/
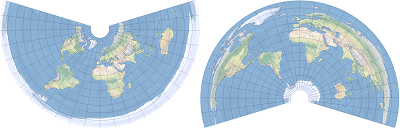
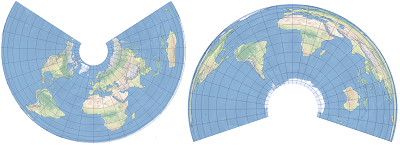
TYPE 2: Conic Map Projections
This type of map projections includes the equidistant conic projection, the Lambert conformal conic, and Albers conic. Here, the meridians are equidistant and the straight lines converge regardless if there is a pole or not, as well as these maps are defined by the cone constant which dictates the angular distance between medians. These maps are designed to be able to be wrapped around a cone or sphere, but at the cost of them being geometrically correct. Because of that, they are best suited to be used as regional or hemispheric maps that can visualize temperate regions, weather maps, and climate projections.

A. Equidistant Conic Projection:
Best suited for land masses extending in an east-to-west orientation, the projection often serves as a compromise between the Lambert and Albers conic. It was first formed by Claudius Ptolemy about A.D 100.
B. Lambert Conformal Conic:
Typically, this map is best for land masses that extend east-to west, but at mid-latitudes, which makes it different compared to the equidistant conic. This map is also useful for official topographic mapping.
lamber conformal conic: https://map-projections.net/single-view/lambert-conformal-conic
C. Albers Conic:
First introduced by Heinrich C. Albers in 1927, this map is commonly used for maps of the contiguous USA, Europe, and Australia, because it is an equal area conic projection. It uses two standard parallels that helps reduce distortion found in those projections with only one standard parallel.
TYPE 3: Azimuthal Map Projections
This map is different than the rest, where it is based on angular distance, also known as the great circle arcs or geodesic arcs. The main features of this projection are the straight meridian lines, and the parallels that are circular around the central point with equidistant parallel spacing. Light paths can also be used with this specific type of projection. Orthographic, stereographic and gnomonic light paths are used when finding direction from any point on earth using the central point.

Now that you are fimilar with the different types of projections, which map projection will you use when needed? Recall that cylindrical maps are very useful for comparing latitudes however they are not great depictions of how the world really looks. Conic map projections are best suited to be used as regional or hemispheric maps that can visualize temperate regions, weather maps, and climate projections, and azimuthal map projections are used for radio and seismic work, as every place in the world will be shown at its true distance and direction from the point of tangency.
The next time you look at a world map, whether it be in a classroom or on a bedroom wall, look a little closer, and maybe you’ll be able to tell what kind of projection it is!
